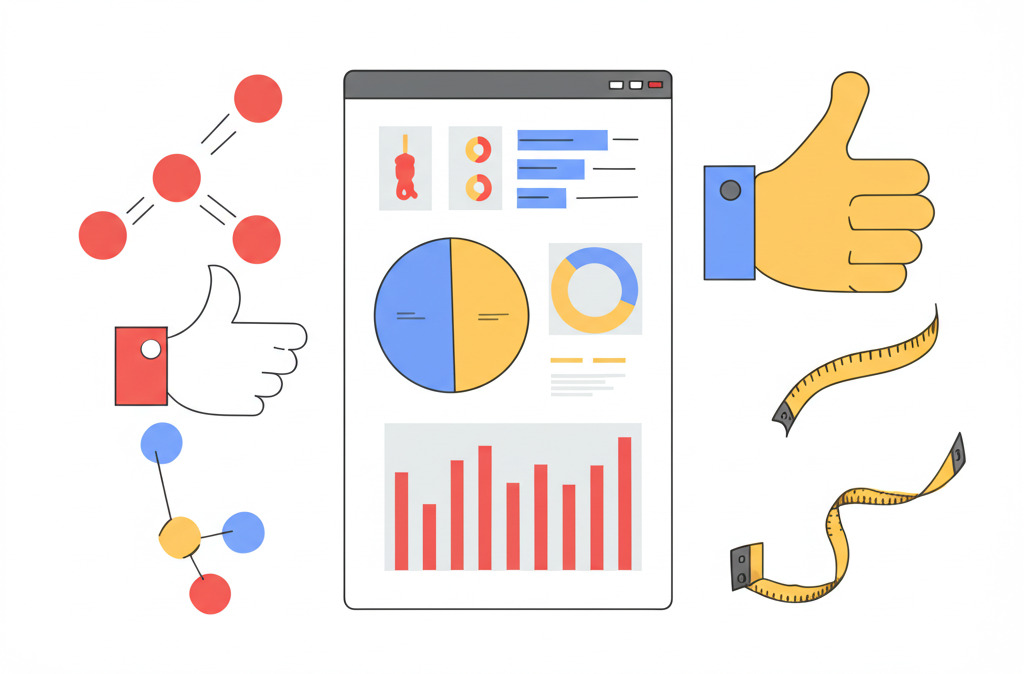
In today’s hyper-connected digital landscape, social media isn’t just a place for sharing updates and cat videos; it’s a powerful engine for business growth, brand building, and customer engagement. But how do you know if your efforts are actually paying off? Are your witty tweets translating into leads? Are those stunning Instagram visuals driving sales? The answer lies in Social Media Analytics.
Simply being present on social platforms isn’t enough. To truly harness their potential, you need to measure, analyze, and interpret the data generated by your activities. This comprehensive guide will delve into the world of social media analytics, exploring how to effectively measure the success of your campaigns, understand key metrics, choose the right tools, and use data-driven insights to optimize your strategy for maximum impact.
Phase 1: Setting the Stage – Laying the Foundation for Measurement
Before diving into dashboards and spreadsheets, effective measurement starts with clarity and preparation. Skipping this phase is like setting sail without a map or destination – you’ll drift aimlessly.
1. Define Clear Campaign Goals and Objectives:
What do you want to achieve with your social media campaign? Your goals should align with broader business objectives and be SMART (Specific, Measurable, Achievable, Relevant, Time-bound). Common social media goals include:
- Increase Brand Awareness: Making more people familiar with your brand, products, or services.
- Drive Website Traffic: Sending users from social media to your website or specific landing pages.
- Generate Leads: Capturing contact information from potential customers.
- Boost Engagement: Encouraging interaction (likes, comments, shares) with your content.
- Increase Sales/Conversions: Directly attributing sales or specific actions (e.g., sign-ups, downloads) to social media efforts.
- Improve Customer Service: Using social media as a channel for support and feedback.
- Build a Community: Fostering a loyal group of followers around your brand.
Example SMART Goal: “Increase website traffic from LinkedIn by 15% within the next quarter (Q3) by sharing targeted content twice weekly.”
2. Identify Key Performance Indicators (KPIs):
KPIs are the specific, quantifiable metrics you will track to determine if you’re meeting your goals. The KPIs you choose must directly relate to your objectives.
- For Brand Awareness: Reach, Impressions, Follower Growth Rate, Social Share of Voice, Brand Mentions.
- For Website Traffic: Clicks, Click-Through Rate (CTR), Website Sessions from Social, Bounce Rate from Social.
- For Lead Generation: Form Submissions (from social links), Gated Content Downloads, Contest Entries, Cost Per Lead (CPL).
- For Engagement: Likes/Reactions, Comments, Shares/Retweets, Saves, Engagement Rate (per post or per follower), Profile Visits, Video Views.
- For Sales/Conversions: Conversion Rate (from social), Revenue Attributed to Social, Cost Per Acquisition (CPA), Return on Ad Spend (ROAS – for paid campaigns).
- For Customer Service: Response Rate, Response Time, Customer Satisfaction (CSAT) scores (if surveyed), Sentiment Analysis.
3. Understand Your Target Audience:
Who are you trying to reach? Knowing your audience’s demographics, interests, online behavior, and preferred platforms is crucial for creating relevant content and interpreting analytics correctly. A high engagement rate from the wrong audience isn’t success.
4. Choose the Right Platforms:
Focus your efforts (and measurement) on the platforms where your target audience is most active and where your goals are most likely to be achieved. Don’t spread yourself too thin.
5. Establish Baselines:
Before launching a new campaign, document your current performance on relevant KPIs. This baseline provides a starting point against which you can measure progress and demonstrate the impact of your efforts.
Build your own digital marketing funnel
Take your marketing to the next level!
Phase 2: Selecting and Utilizing Analytics Tools
Manually tracking every like and share is impossible at scale. Thankfully, numerous tools can help automate data collection and provide valuable insights.
1. Native Platform Analytics:
Most major social media platforms offer built-in analytics dashboards for business accounts. These are free and provide a wealth of platform-specific data:
- Facebook Insights: Tracks reach, engagement, page views, follower demographics, post performance, video metrics, and more.
- Instagram Insights: Provides data on profile visits, reach, impressions, follower demographics, top posts/stories/reels, website taps, and audience activity times.
- Twitter Analytics (X Analytics): Shows tweet impressions, engagement rate, profile visits, follower growth, audience interests, and video views.
- LinkedIn Analytics: Offers insights into page views, unique visitors, follower demographics (job function, industry, seniority), post impressions, clicks, engagement rate, and competitor benchmarking.
- Pinterest Analytics: Tracks impressions, engagement, saves, outbound clicks, audience demographics, and top-performing pins.
- TikTok Analytics: Provides data on video views, profile views, follower growth, trending videos, audience demographics, and traffic sources.
Pro Tip: Regularly export data from native platforms for deeper analysis and historical tracking, as some only store data for a limited time.
2. Third-Party Social Media Analytics Tools:
While native analytics are essential, third-party tools often offer more advanced features, cross-platform reporting, competitor analysis, and workflow integrations. Popular options include:
- Buffer Analyze: Comprehensive reporting, custom dashboards, post performance analysis, audience demographics, and Instagram Stories analytics.
- Hootsuite Analytics: Tracks key metrics across multiple platforms, customizable reports, team performance tracking, ROI measurement, and competitive benchmarking.
- Sprout Social: In-depth analytics on post performance, audience engagement, team productivity, competitive analysis, trend identification, and paid campaign performance.
- Keyhole: Real-time hashtag tracking, campaign monitoring, influencer marketing analytics, market research, and sentiment analysis.
- Agorapulse: Unified social inbox, scheduling, monitoring, and robust reporting features, including content performance, community management metrics, and ROI calculation.
The best tool depends on your specific needs, budget, and the platforms you use most.
3. Website Analytics (Google Analytics 4 – GA4):
To measure traffic and conversions driven by social media, you need website analytics. GA4 can show you:
- How much traffic is coming from each social platform.
- The behavior of social media visitors on your site (pages visited, time on site).
- Conversions (goals completed) attributed to social media channels.
4. UTM Parameters:
Urchin Tracking Modules (UTMs) are snippets of text added to the end of a URL to help you track the source, medium, and campaign name associated with specific links shared on social media. This allows for more granular tracking within Google Analytics, helping you understand which specific posts or campaigns are driving the most valuable traffic and conversions.
Example UTM’d URL: `https://yourwebsite.com/landing-page?utm_source=facebook&utm_medium=social&utm_campaign=summer_sale`

Phase 3: Deep Dive into Key Metrics and Interpretation
Collecting data is only half the battle; understanding what it means is where the real value lies. Let’s break down common metrics by goal category:
Awareness Metrics:
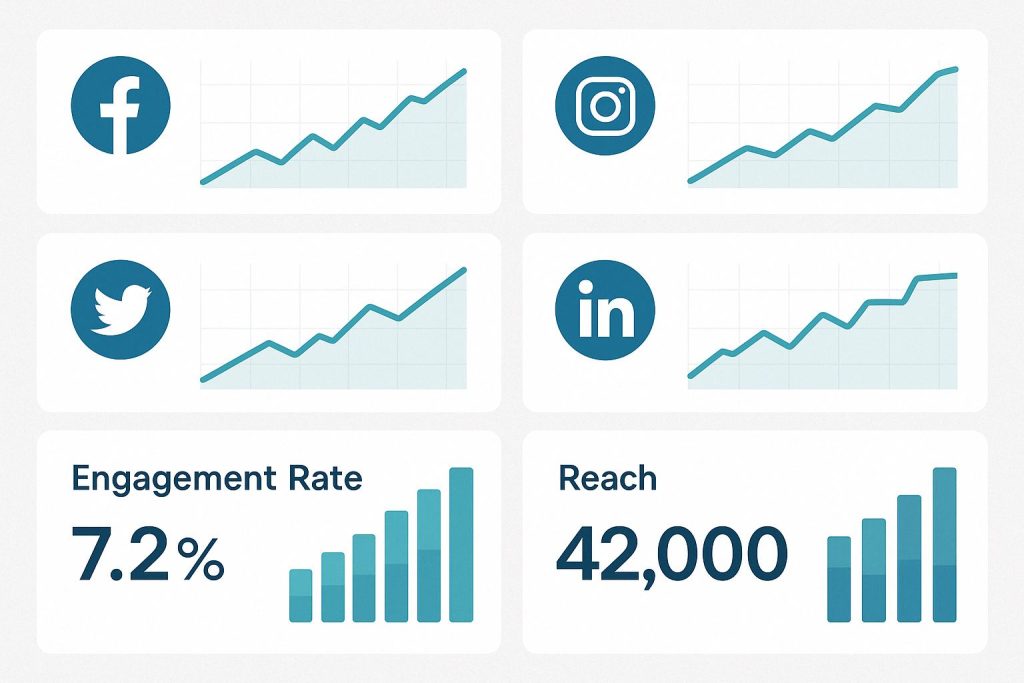
- Reach: The total number of unique users who saw your content. High reach suggests your content is spreading widely, potentially beyond your immediate followers.
- Impressions: The total number of times your content was displayed (a single user could account for multiple impressions). High impressions relative to reach might indicate users are seeing your content multiple times.
- Brand Mentions: How often your brand name (or related keywords) is mentioned across social media (tracked using monitoring tools). An increase indicates growing conversation around your brand.
- Social Share of Voice (SSoV): Measures how much of the conversation within your industry or about specific keywords revolves around your brand compared to competitors. Formula: `(Your Brand Mentions / Total Industry Mentions) * 100`.
Engagement Metrics:
- Likes/Reactions: Basic indicators of content resonance, but often considered a “vanity metric” if not paired with deeper engagement.
- Comments: A stronger indicator of engagement, showing users are actively participating in the conversation. Analyze comment sentiment and themes.
- Shares/Retweets: Indicates users found your content valuable enough to share with their own networks, significantly boosting reach.
- Clicks (Link Clicks): Shows users were interested enough to leave the social platform and visit your link (website, landing page, etc.).
- Engagement Rate: A crucial metric measuring the percentage of people who interacted with your content after seeing it. There are several ways to calculate it:
- Engagement Rate by Reach (ERR): `(Total Engagements / Reach) * 100`. Measures engagement among those who actually saw the post.
- Engagement Rate by Followers (ERF): `(Total Engagements / Total Followers) * 100`. Measures engagement relative to your audience size (can be lower due to algorithms limiting reach).
- Engagement Rate per Post: Often calculated by platforms relative to impressions.
- Video Views & Watch Time: Crucial for video content. Look at view counts, average watch time, and audience retention graphs to see where viewers drop off.
Interpretation: High engagement rates suggest your content resonates with your audience. Low engagement might mean your content isn’t relevant, visually appealing, or posted at the right time.
Conversion Metrics:
- Website Clicks/CTR (Click-Through Rate): `(Total Clicks / Total Impressions) * 100`. Measures how effective your post was at driving clicks relative to how many times it was seen.
- Conversion Rate: `(Total Conversions from Social / Total Clicks from Social) * 100`. The percentage of visitors from social media who completed a desired action (e.g., purchase, sign-up) on your website. Requires conversion tracking setup in GA4.
- Leads Generated: The number of leads directly attributed to social media efforts (tracked via UTMs or specific landing pages).
- Revenue Attributed to Social: The amount of sales revenue generated from customers who originated from or interacted with social media channels (requires robust tracking).
- Cost Per Conversion/Lead (CPC/CPL): `Total Ad Spend / Total Conversions or Leads`. Essential for evaluating the efficiency of paid social campaigns.
- Return on Ad Spend (ROAS): `(Revenue from Ad Campaign / Cost of Ad Campaign) * 100`. Measures the profitability of paid social efforts.
Interpretation: Conversion metrics directly tie social media activity to tangible business outcomes. Low conversion rates despite high traffic might indicate issues with your landing page or offer, not necessarily the social post itself.
Audience Metrics:
- Demographics: Age, gender, location, language of your followers. Helps verify if you’re reaching your target audience.
- Follower Growth Rate: Tracks how quickly (or slowly) you’re gaining new followers.
- Top Performing Content (by Audience Segment): Identify which types of content resonate most with specific demographic groups within your audience.
Customer Service & Sentiment Metrics:
- Response Rate & Time: How quickly and consistently you respond to comments and messages. Crucial for customer satisfaction.
- Sentiment Analysis: Uses AI (often in third-party tools) to classify brand mentions and comments as positive, negative, or neutral. Provides a qualitative overlay to quantitative data.
Unleash the power of digital marketing
Ready to grow your business ?
Phase 4: Reporting, Optimization, and Iteration
Data is useless if it isn’t used to inform action. The final phase involves synthesizing your findings and using them to improve future campaigns.
1. Create Meaningful Reports:
Don’t just dump raw data. Tailor reports to your audience (e.g., executive summary vs. detailed analysis for the marketing team). Reports should include:
- Key KPIs vs. Goals: Clearly show progress towards objectives.
- Visualizations: Charts and graphs make data easier to understand.
- Top Performing Content: Highlight what worked well (and why).
- Underperforming Content: Identify what didn’t work (and potential reasons).
- Audience Insights: Key takeaways about who you’re reaching.
- Key Insights & Analysis: Go beyond the numbers – what does the data *mean*?
- Recommendations & Next Steps: Propose actionable changes based on the findings.
2. Determine Reporting Frequency:
How often you report depends on the campaign length and your needs. Common cadences include:
- Weekly/Bi-Weekly: For ongoing monitoring and minor adjustments.
- Monthly: For tracking trends and overall progress.
- Quarterly: For strategic reviews and goal assessment.
- Campaign-Specific: Pre-, mid-, and post-campaign reports for evaluating specific initiatives.
3. A/B Test Your Content and Strategy:
Use analytics insights to fuel experimentation. Test different:
- Content Formats: Images vs. videos vs. carousels vs. text-only.
- Visual Styles: Different aesthetics, colors, filters.
- Copywriting: Different headlines, calls to action (CTAs), lengths, tones.
- Posting Times/Days: Use audience activity data to optimize scheduling.
- Targeting Options (for paid ads): Different demographics, interests, lookalike audiences.
Measure the results of your tests rigorously to determine winners.
4. Iterate and Optimize:
Social media analytics is not a one-time task; it’s a continuous cycle. Use your reports and test results to:
- Refine your content strategy: Double down on what works, discard what doesn’t.
- Adjust your targeting: Focus on the audience segments engaging most.
- Optimize your budget allocation: Invest more in high-performing platforms, campaigns, or ad sets.
- Improve your posting schedule: Post when your audience is most active.
- Update your goals and KPIs: As your strategy evolves, so should your measurement framework.
5. Connect Social Data to Business Outcomes:
Ultimately, the goal is to demonstrate how social media contributes to the bottom line. Combine social media data with data from your CRM, sales platforms, and website analytics to paint a complete picture of the customer journey and social media’s role within it.
Conclusion: Turning Data into Action
Social media analytics transforms your social media presence from a guessing game into a strategic, data-driven operation. By setting clear goals, tracking the right KPIs with appropriate tools, understanding what the metrics mean, and consistently reporting and optimizing, you can demonstrably improve your campaign performance and prove the value of social media to your organization. Don’t be intimidated by the data; embrace it as your guide to smarter, more effective social media marketing that drives real business results.
Frequently Asked Questions (FAQ)
What exactly is Social Media Analytics?
Social Media Analytics is the process of gathering, analyzing, and interpreting data from social media platforms to understand campaign performance, audience behavior, and market trends. It helps measure the effectiveness of your social media strategy against your goals.
Why is Social Media Analytics important?
It allows you to:
– Understand what content resonates with your audience.
– Measure the ROI of your social media efforts.
– Make data-driven decisions to optimize your strategy.
– Track competitor activity and industry trends.
– Prove the value of social media to stakeholders.
What’s the difference between Reach and Impressions?
Reach is the number of unique users who saw your content.
Impressions are the total number of times your content was displayed (can include multiple views by the same user).
What is a ‘good’ Engagement Rate?
There’s no single answer, as ‘good’ varies significantly by platform, industry, audience size, and content type. Generally, rates between 1% and 5% are often cited, but it’s more important to benchmark against your own past performance and industry standards if available. Focus on improving your own rate over time.
Should I focus more on native analytics or third-party tools?
Start with native analytics – they’re free and provide essential platform-specific data. Consider third-party tools if you need cross-platform reporting, deeper competitor analysis, advanced features like sentiment analysis, or manage multiple accounts/team members. Often, a combination of both is ideal.
How do UTM parameters help with social media analytics?
UTM parameters allow you to tag links shared on social media. When a user clicks that link, Google Analytics (or other web analytics tools) can precisely identify the source (e.g., Facebook), medium (e.g., social), and specific campaign (e.g., summer_sale) that drove the visit, enabling accurate tracking of traffic and conversions from specific social efforts.
How often should I check my social media analytics?
It depends. A quick daily check on key metrics like mentions or urgent comments might be needed. Deeper analysis is often done weekly or bi-weekly for ongoing monitoring. Comprehensive reports are typically generated monthly or quarterly, and specific campaign reports follow the campaign timeline. Avoid obsessive checking; focus on meaningful trends.
What are ‘vanity metrics’ and should I ignore them?
Vanity metrics (like total follower count or simple likes) look good on the surface but don’t always correlate directly with business goals. Don’t ignore them entirely (e.g., follower growth shows audience building), but prioritize metrics that align with your objectives (like engagement rate, CTR, conversions) for strategic decision-making.
How can I measure the ROI of organic (non-paid) social media?
Measuring organic ROI is challenging but possible. Track conversions driven by organic social traffic using UTMs and GA4. Assign a value to leads generated or conversions. You can also consider the ‘earned media value’ of engagement and reach, or factor in cost savings from using social for customer service compared to traditional channels. While harder to quantify precisely than paid ROI, tracking conversions is key.
What is Sentiment Analysis?
Sentiment analysis uses Natural Language Processing (NLP) and AI to automatically classify mentions of your brand or specific topics as positive, negative, or neutral. It helps gauge public perception and understand the context behind engagement numbers.